Content for New Div Tag Goes Here
CANADA HISTORY - Elections
election details
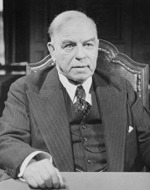
Mackenzie King - Liberal
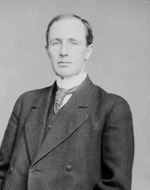
Arthur Meighen - Conservative
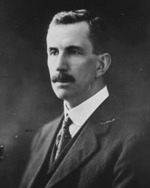
T.A. Crerar

JS Woodsworth - Labour
| Election Party |
Elected Members | # of Candidates | % of Popular Vote | % of Seats |
|---|---|---|---|---|
| 1921 (December 6) - Turnout: 67.7 % | ||||
| Liberal | 116 | 202 | 40.7 % | 49.4 % |
| Other Includes votes for the Progressive Party | 69 | 225 | 29 .0 % | 29.4 % |
| Conservative | 50 | 208 | 30.3 % | 21.3 % |
| Total | 235 | 635 | ||
| Government--116, Opposition--119, Minority--3 | ||||
| Total - 221 | Conservative | Liberal | Progresive | Labour | Other |
| Canada | 49 | 118 | 58 | 3 | 7 |
| PEI | 4 | - | |||
| Nova Scotia | 16 | - | |||
| New Brunswick | 5 | 5 | 1 | - | |
| Quebec | 65 | ||||
| Ontario | 36 | 21 | 20 | 5 | |
| Manitoba | 3 | 11 | 1 | - | |
| Saskatchewan | 1 | 15 | - | ||
| Alberta | - | 8 | 2 | 2 | |
| BC | 7 | 3 | 3 | - | |
| Yukon & NWT | 1 | - | - |
Cite Article : Reference: www.canadahistory.com/sections/documents/documents.html
Source: NA